How Hazard Perception Can Identify Risk in Professional Drivers
The eyes have it! Can you spot the safe from less safe driver?
Take a look at this video below, it shows the eye-movements of two Fire and Rescue Service drivers who watched one of our hazard clips filmed from a fire appliance on a blue light run. You will see lines and circles being drawn on top of the video as it plays. The lines represent the trajectory of the drivers’ eyes as they jump from one place to another. When the eyes land on a new area, a circle begins to grow. These circles represent the amount of time that the drivers’ eyes are fixed in one area of the video (and are thus called fixations). The larger the circle grows, the longer the fixation. These fixations show us what the drivers are currently thinking about, and give us insight into their hazard perception skill and how they read the road.
You will also notice that one set of lines and circles is blue, while another set is drawn in orange. The colours represent the two drivers. One of the drivers is considered ‘low-risk’; they are highly experienced and with few, if any, crashes while driving for the fire service. The other driver is ‘high-risk’. We know that this driver has been involved in significantly more crashes while driving for the fire service than our low-risk driver.
The question is: Can you tell which one of the drivers – orange or blue – is the ‘high-risk’ driver?
What happened in this clip? You should have noted that the fire appliance was passing a bus on its right, when a car almost emerged from a side road behind the bus into the path of the emergency vehicle. This is our hazard. Fortunately, the car decided against pulling out, but it is still important that our drivers spot this hazard as soon as possible.
If you looked closely, you will have been able to see that our orange driver looked at the hazard first. The blue driver looks at the hazard too, but somewhat later. It might seem that the difference in timing between when the two drivers looked at the hazard is quite small, but even half a second’s advanced notice could be the difference between a crash or avoiding the hazard.
Unsurprisingly, the orange driver was our low-risk driver, while the blue driver was classed as high-risk according to the number of previous collisions.
If we were always able to tell where drivers were looking, perhaps we would have a good chance of identifying those drivers who are more likely to have a collision in the future. While eye tracking technology has improved incredibly over the years, it remains somewhat specialist and expensive equipment. Fortunately, there is a cheaper and easier way to assess how good drivers are at reading the road…
In two of our recent blogs, we explored some of the benefits of hazard perception assessment and training for both learner and fleet drivers. Over 50 years of research demonstrates that hazard perception skill is consistently linked to collision risk and that the test can discriminate safe from less safer drivers. In addition to this, the benefits of the test are undeniable, with estimates suggesting an annual saving of nearly £90 million and a reduction of over 8500 damage-only collisions and over 1000 injury collisions, as a direct result of the introduction of the test.
Essentially, hazard perception tests are doing the same thing as our eye tracking study – separating our safe from less-safe drivers on the basis of whether they look at hazards. With eye tracking equipment we can definitively tell if and when a driver looks at a hazard. With a hazard test however we record drivers’ response times to seeing a hazard, which should relate directly to when they first spotted the hazard – but are a lot cheaper than using complex eye tracking equipment!
Despite these successes, the approach has yet to gain traction in the fleet training and assessment industry for identifying risk in fleets drivers. Reasons for this are without a doubt multifaceted, and we alluded to some of these in our previous blogs, namely, the test’s use of ambiguous scoring windows (where professional drivers often report pressing before the scoring window opens as they predict the hazard so far in advance), lack of a measure of accuracy (we have no idea what they are pressing for), and lack of vehicle-specific and role-specific content on the market. For example, HGV drivers will complete a hazard test designed for learner drivers, viewed from a car-driver’s perspective, which does not really reflect the hazards that HGV drivers encounter. Fortunately, there are variations of the hazard perception test that can avoid these issues whilst being able to identify driver risk, even better than the traditional test!
The Hazard Prediction Test
Several alternative tests have been developed to overcome the ambiguity of the button response, with some tests requiring users to click on the area of the scene where the hazard appears (yet still within a time window). Other variations remove the need for a scoring window altogether. Instead of pressing a button as quickly as possible when a hazard is detected, the video stops just as the hazard begins, and the screen is occluded. The driver is simply asked, “What happens next?” and must choose from one of the four options on the screen. If the driver has read the road appropriately, they should be able to identify the correct answer, thus a measure of accuracy is provided. This test is known as the ‘Hazard Prediction Test’, and we have published evidence to show this test is better suited to professional fleet drivers than the traditional DVSA button-response test when you need to identify risk within your fleet.
How is the Hazard Prediction Test Relevant for Professional Drivers?
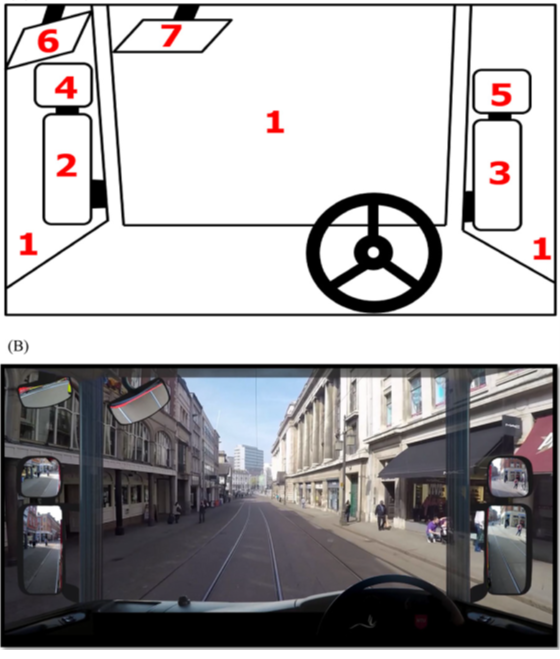
In a research project conducted at Nottingham Trent University, we developed both a hazard perception and a prediction test for professional fire service drivers. The aim of the study was to develop a test that could identify safe from less-safe drivers to better target training needs within the fire service. With assistance from Nottinghamshire Fire and Rescue Service (NFRS), the project began by filming from fire appliances on blue-light training runs around Nottinghamshire for two weeks. A multi-camera system was used to capture footage from the forward view of the cabin and the 6 views that the driver can see through the mirrors (see Figure 1).

Once all the footage was collected, the footage was edited into a graphical overlay that had been designed to represent the interior cabin of a fire appliance (see Fig 1 – bottom panel).
The footage was then reviewed by a team of transport psychologists and fire service personnel to identify content of interest. A selection clips were chosen on the basis that they provided at least one hazard of sufficient concern. These clips were then developed into both a hazard perception and a hazard prediction test.
For the hazard perception test, hazard windows were set using an onset (earliest point hazard could be detected) and offset time (latest point a driver could make a correct response to the hazard). For the prediction test, the clips were edited to finish just as the hazard became visible. At this point the screen was occluded, and we asked drivers ‘What happens next?’, with four possible options displayed onscreen (only one was the correct answer, and was indeed what happened next!).
How can we know that the tests work?
With the tests developed, we then wanted to determine whether either test was able to identify risk in professional fire service drivers. You might wonder just how researchers know that their tests work? How can we be sure that a test can identify those risker drivers who are more likely to have a collision in the future?
To answer these questions, researchers typically evaluate tests using safe and less-safe drivers (defined objectively by their collision history), or they use novice and experienced drivers (as we know that novice drivers are far more likely to have a collision than experienced drivers). If a hazard test is to be deemed valid, it must show a statistically significant difference between the scores of these two groups of drivers. If this is the case, we can be more confident that the test is truly measuring our targeted driver safety skill.
Testing Drivers!
To validate our fire appliance hazard prediction and perception tests, we tested both assessments on four different driver groups. The first group represented novice fire appliance drivers who were currently going through training. The second group were classed as experienced drivers, these were split further into high and low-risk groups based on their previous collision history in the fire service (including measures of blame and severity). A final control group consisted of normal car drivers (not with the fire service), who were matched to the fire service drivers, in terms of their age and driving experience. All drivers completed both the hazard prediction test (where the screen occluded at hazard onset and the drivers were given four possible outcomes to choose between) and the hazard perception test, which used the traditional push-button method requiring speeded responses to hazards. And we recorded their eye movements too.
What did we find?
For the hazard perception test, we found that all fire service drivers (regardless of experience) were faster at detecting the hazards than the car drivers. Whilst this suggests the fire service are better than the average car driver (which is good news!) this result was not particularly helpful to the fire service. They really wanted to use the test to identify which of their drivers might have a crash in the future.
Interestingly, their eye-movements showed that the experienced fire service drivers spotted more hazards and looked at them faster and for longer than the novice fire service drivers. Yet, even though the experienced drivers were spotting the hazards faster, this wasn’t reflected in their response times.
“But I thought you said response times should directly relate to how quickly one looks at a hazard?”
Theoretically, yes. But there is evidence that the relationship between looking at a hazard and pressing a button is more complex than we might think.
Unfortunately, pressing the button does not just measure the time it takes to spot a hazard. It also includes the time that drivers take to decide that it really is a hazard. When drivers judge whether something is hazardous or not, they compare it to events they have witnessed during their years of driving. As highly experienced and trained drivers are more likely to avoided a range of hazards over the years, they may spot a hazard quickly, but may then let the hazard develop before they consider it to be a hazard to themselves. Psychologists call this criterion bias, and this could explain why some may allow a hazard to develop more before making a response. Regardless of the reason, short of putting eye-trackers on all fire service drivers, our fire appliance FA hazard perception test was not that useful to the fire service for identifying which of their drivers are most at risk of a collision.
For the hazard prediction test, we observed again that our control group of car drivers were worse at predicting the upcoming hazard (remember, this test uses a measure of accuracy, not a response time). However, we also found that the low-risk FA drivers were now significantly better at predicting the upcoming hazard than the high-risk drivers! Finally we had a test that could be used to identify which fire service drivers are at greater risk of collision (without having to rollout expensive eye tracking equipment in every fire station!).
Overall Conclusion
Whilst both the hazard perception and hazard prediction tests could identify a difference between normal car drivers and fire service drivers, only the hazard prediction test was able to discriminate between safe and less-safe fire service drivers. Following this, Nottinghamshire Fire and Rescue Service rolled out the use of our hazard prediction test with their drivers in both acquisition and refresher training.
This research focused on one type of professional drivers – fire appliance drivers – but as discussed in our previous blog, different driving roles encounter different hazards. We believe that any hazard assessment or training should match both the type of driving and vehicle that a driver does in real life. To that end, we have been developing different hazard tests for these different roles and we now assessments and training available for HGVs, cars, vans and even cars on emergency response drives.
Latest Blogs
If you want to find out hazard perception testing can improve your fleets safety, get in touch for a no-obligation chat.


